S&P500 Daily Action Areas & Price Targets 16/6/26
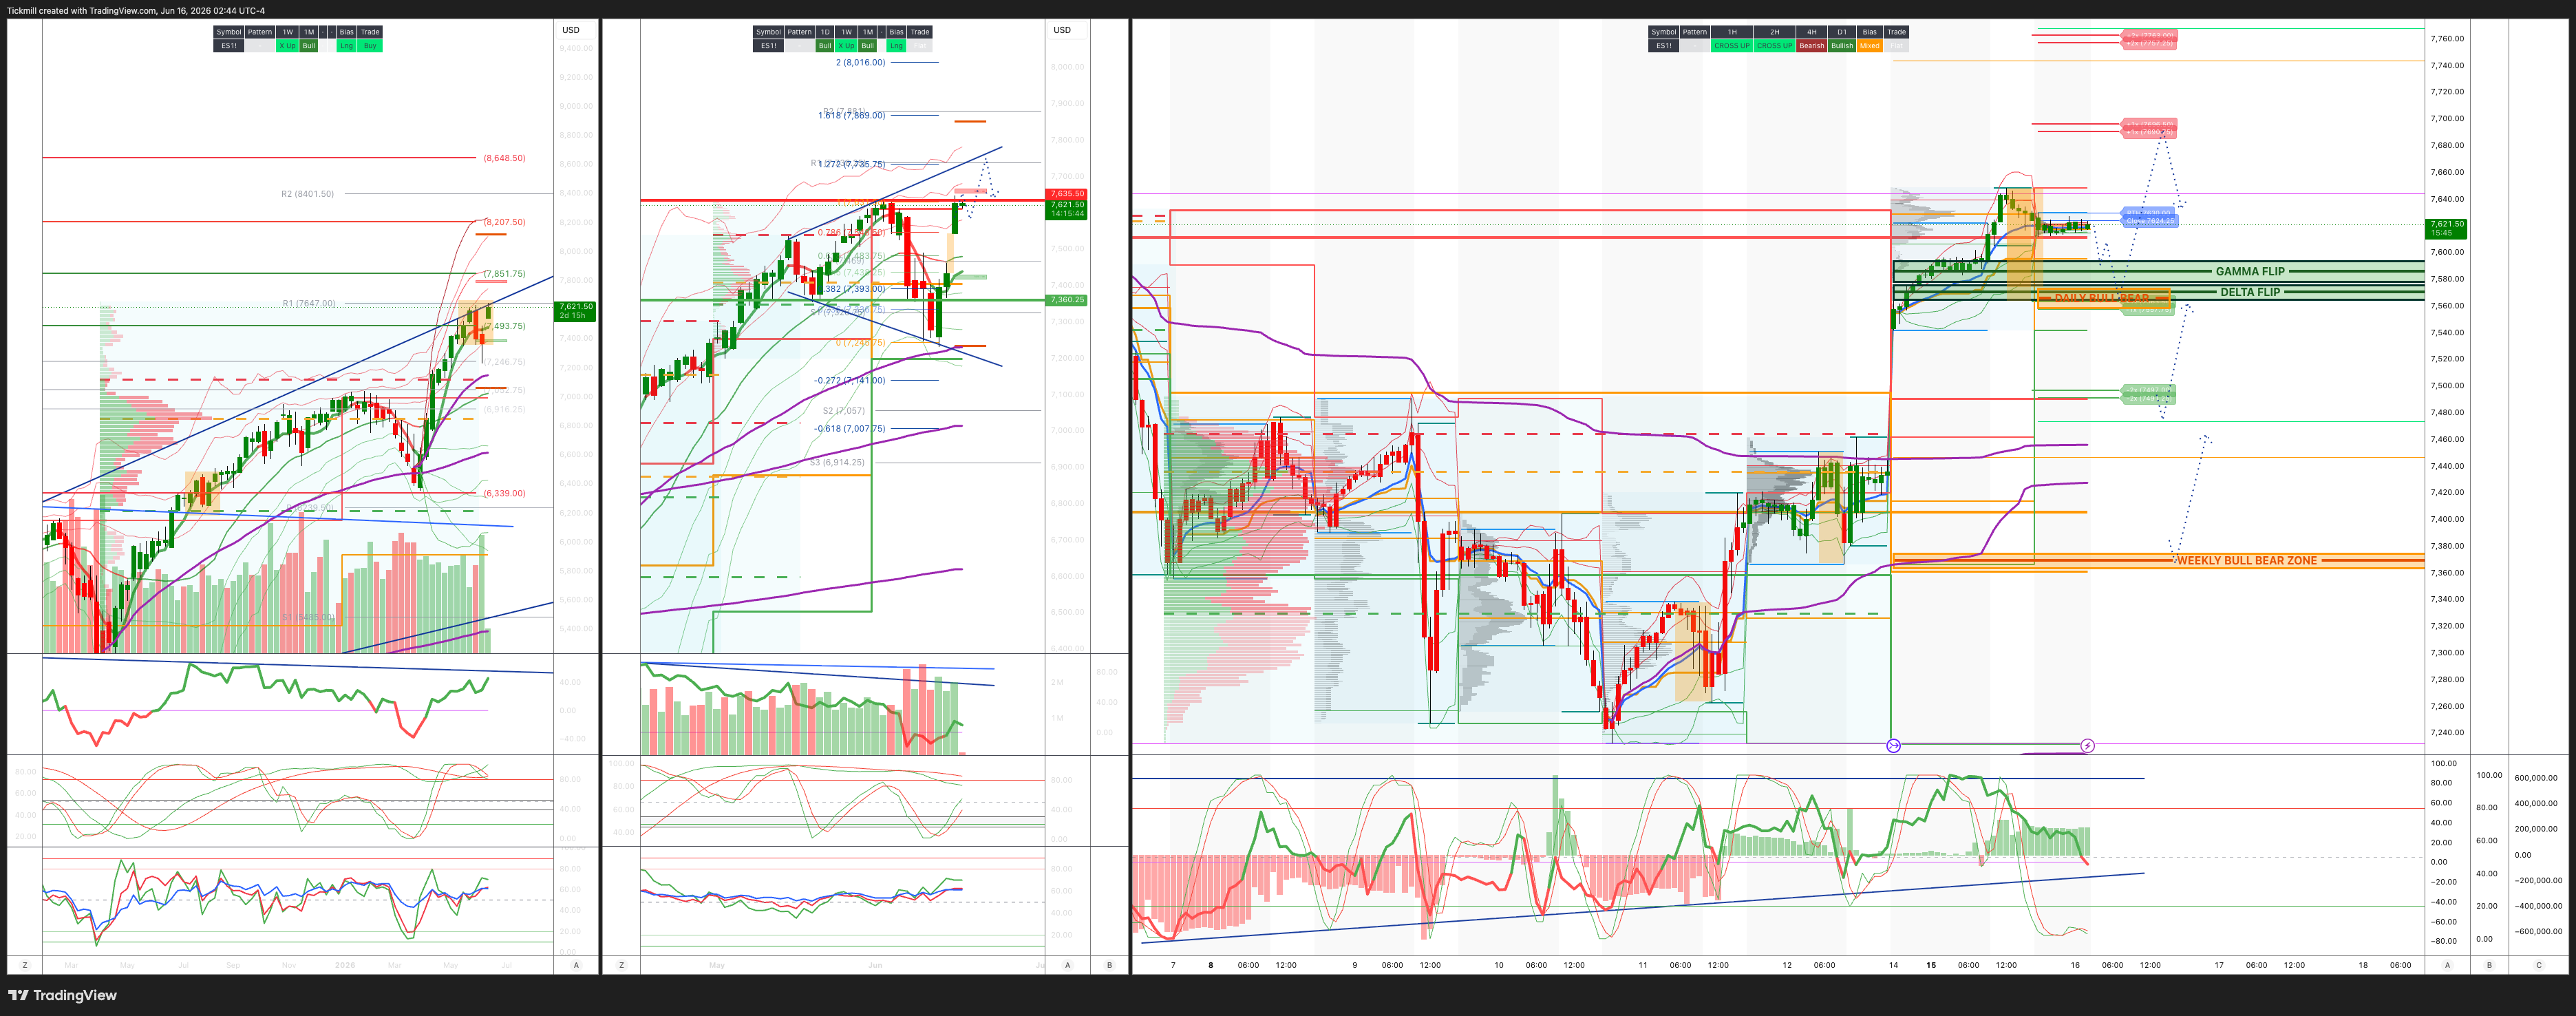
S&P500 Daily Action Areas & Price Targets 16/6/26
***QUOTING ES1! FOR CASH US500 EQUIVALENT LEVELS, SUBTRACT POINT DIFFERENCE***
WEEKLY BULL BEAR ZONE 7365/75
WEEKLY RANGE RES 7635 SUP 7360
June MOPEX Straddle: 274pt range implies a OPEX to OPEX range of [7134, 7683]
June QOPEX Straddle is 546.4pt giving us a range of [5960,7052]
JHEQX Q2 Collar 6189/6290 - 6865/6955
DEC2025 OPEX to DEC2026 OPEX is 945 points giving us a range of [5889,7779]
SPX PUT/CALL RATIO 1.15 (The numbers reflect options traded during the current session. A put-call ratio below 0.7 is generally considered bullish, and a put-call ratio above 1.0 is generally considered bearish)
DAILY VWAP BULLISH 7439
WEEKLY VWAP BEARISH 7474
MONTHLY VWAP BULLISH 7036
DAILY STRUCTURE - OTFH - 7366
WEEKLY STRUCTURE - OTFH
MONTHLY STRUCTURE - OTFH - 7199
Balance: This refers to a market condition where prices move within a defined range, reflecting uncertainty as participants await further market-generated information. Our approach to balance includes favouring fade trades at the range extremes (highs/lows) while preparing for potential breakout scenarios if the balance shifts.
One-Time Framing Higher (OTFH): This represents a market trend where each successive bar forms a higher low, signalling a strong and consistent upward movement.
One-Time Framing Lower (OTFL): This describes a market trend where each successive bar forms a lower high, indicating a pronounced and steady downward movement.
DAILY BULL BEAR ZONE 7570/60
GAMMA FLIP 7585
DELTA FLIP 7569
DAILY RANGE RES 7692 SUP 7428
2 SIGMA RES 7634 SUP 7360
VIX BULL BEAR ZONE 19
TRADES & TARGETS
LONG ON REJECT/RECLAIM DAILY BULL BEAR ZONE TARGET 7630 > DAILY RANGE RES
SHORT ON REJECT/RECLAIM DAILY RANGE RES TARGET 7630
***ADDITIONAL SETUPS & TARGETS HIGHLIGHTED ON THE CHARTS***
(I FADE TESTS OF 2 SIGMA LEVELS ESPECIALLY INTO THE FINAL HOUR OF THE NY CASH SESSION AS 90% OF THE TIME WHEN TESTED THE MARKET WILL CLOSE ABOVE OR BELOW THESE LEVELS)
GOLDMAN SACHS TRADING DESK VIEW - ‘Rising Tide’
The market extended the aggressive risk-on rally as the US and Iran reached a formal agreement to re-open the Strait of Hormuz, setting up 60 days of negotiations over Iran’s nuclear program and a planned signing in Switzerland on Friday. No text of the agreement has been released, so the market is still relying heavily on headline interpretation, but price action clearly treated the news as a major de-escalation. The S&P rose 1.65% to 7,554, the Nasdaq 100 surged 3.06% to 30,543, the Russell gained 0.72% to 2,965, and the Dow rose 0.92% to 51,671. Volumes were elevated at 21.361bn shares versus a YTD daily average of 19.296bn, although floor activity itself was only 4 out of 10, underscoring how powerful the move was relative to actual discretionary engagement.
Cross-asset confirmation was very supportive for equities. WTI crude fell another 4.22% to $81.30 as the Strait reopening agreement removed a large part of the geopolitical supply-risk premium. The 10-year yield was essentially unchanged at 4.471%, the dollar was slightly weaker, Bitcoin rallied 4.03% to $66,551, and VIX dropped sharply to 16.2. Gold also rose 2.22% to 4,312, which complicates the simple risk-on read but is consistent with a weaker dollar, lower geopolitical tail hedging costs, and continued demand for real assets in a world where inflation and policy credibility questions have not disappeared.
Under the hood, the rally was exactly the kind of risk-on posture one would expect after a geopolitical tail-risk release. AI, beta, high-velocity growth, and Mega-Cap Tech led the tape higher, while defensive pockets lagged. Consumer retail underperformed, which felt less like a macro warning and more like rotation back into Tech and growth after last week’s de-risking. The Mega-Cap bounce looked like an abatement of supply rather than a fresh fundamental discovery. Recall that last week the desk saw notable long-only funding supply in Mega-Cap Tech; yesterday’s move suggests that supply either slowed or was overwhelmed by renewed demand and short-covering.
The flow picture was notable. The floor finished +711bps better to buy versus a 30-day average of just +16bps. Hedge funds were net sellers, with supply in Communication Services, macro, and Tech, against scattered demand in Discretionary. Asset managers, by contrast, were large net buyers, driven by broad demand in Tech and macro expressions. That mix matters because the rally was not simply hedge funds chasing risk. Long-only demand returned to the parts of the market that had just been under pressure, particularly Tech. At the same time, hedge fund selling into strength suggests some players are using the rally to reduce exposure rather than re-risk aggressively.
Financials were strong in several unloved war-laggard pockets. Consumer finance rose roughly 5%, payments gained around 4%, and mortgage-related names were high-single-digit percentage winners. That is consistent with relief from lower oil, reduced geopolitical stress, and a renewed bid for domestic cyclicals that had been left behind. The move also fits the broader broadening framework, although yesterday’s tape was more heavily led by Tech and high-beta growth than by equal-weight or small-cap leadership. The Russell’s relative underperformance versus NDX shows that this was not a pure broadening day; it was more a Tech-led relief squeeze with some cyclical catch-up in select pockets.
The FOMC is now the main event, and the setup is unusually important because it is Kevin Warsh’s first meeting as Chair. The funds rate is expected to remain unchanged at 3.50–3.75%, and the Fed is likely to remove prior forward guidance suggesting cuts. The median dot is expected to show no change to the funds rate in 2026, with two cuts penciled in for 2027, likely June and September. The decision itself should not be the catalyst. The press conference, reaction function, and Warsh’s framing of inflation, growth, productivity, and Fed credibility will be the market-moving variables.
The key question is whether Warsh validates the market’s “higher floor” view without sounding aggressively hawkish. Inflation remains too high, PPI is hot, payrolls are solid, and financial conditions are easing again as equities rally and VIX collapses. In a vacuum, those are not obviously dovish conditions. But lower oil and the geopolitical resolution give the Fed some room to avoid sounding alarmist. If Warsh signals that no cuts are coming this year but does not lean into near-term hike risk, equities may be able to digest it. If he emphasizes inflation credibility and leaves the door meaningfully open to further tightening, the front end could sell off and Tech could face renewed pressure.
Derivatives were quieter than the magnitude of the spot rally would imply. Even though the S&P straddle realized more than 3x to the upside, the vol market did not chase the move aggressively. SPX fixed-strike vols closed small offered in the front end but bid further out the curve. That suggests investors are willing to sell immediate event/rally vol, while still maintaining some demand for medium-term protection around the Fed, summer liquidity, issuance, and AI-capex uncertainty. RUT vol was offered across the curve, consistent with Russell underperformance and less immediate demand for small-cap optionality.
Skew relaxed across all three major indices, especially in SPX. That is exactly what should happen when a major geopolitical left-tail is removed and spot rallies sharply. The desk saw index vol sellers, and systematic vol selling is expected to be a key theme this week, especially in the shortened week. This could be compounded by VIX complex unwind ahead of expiry. The setup creates a potentially self-reinforcing vol compression dynamic: spot rallies, realized downside risk falls, front-end implied vol is sold, VIX products rebalance, and systematic sellers add pressure to volatility.
The risk is that vol selling into a low-liquidity summer tape can create a false sense of stability. Top-of-book liquidity has already been poor, and the market has recently shown that even modest flow imbalances can generate outsized price moves. If the Fed press conference lands hawkishly, if the Iran agreement details disappoint, or if oil reverses sharply, the market could discover that implied volatility has been compressed too far. For now, however, the path of least resistance is lower front-end vol and higher spot, especially if systematic vol sellers are active.
The energy ecosystem was active in derivatives and cash as investors repositioned around the geopolitical resolution. The front-end crude selloff is straightforward, but the more important signal remains the back end of the curve, especially Dec26 Brent. If longer-dated crude keeps falling, the market is saying the agreement has structurally reduced energy-supply risk and that demand concerns remain dominant. If the back end stabilizes or backs up, then yesterday’s move is more about removing near-term tail risk than changing the longer-term energy regime.
The AI and Mega-Cap Tech rebound remains tactically powerful, but it does not fully resolve the medium-term debate. The rally benefited from lower oil, lower VIX, stable yields, reduced geopolitical risk, and prior supply abatement. But the AI complex still faces the same structural crosscurrents: capex estimates may be too low, token usage may grow significantly, and infrastructure earnings may be revised higher; at the same time, model orchestration, open-source competition, token deflation, heavy issuance, and return-on-capital scrutiny all remain risks. Yesterday’s price action says the market wants to re-own AI when macro tail risks fade. It does not say the market has settled the economics of the AI capex cycle.
Disclaimer: The material provided is for information purposes only and should not be considered as investment advice. The views, information, or opinions expressed in the text belong solely to the author, and not to the author’s employer, organization, committee or other group or individual or company.
Past performance is not indicative of future results.
High Risk Warning: CFDs are complex instruments and come with a high risk of losing money rapidly due to leverage. 71% and 74% of retail investor accounts lose money when trading CFDs with Tickmill UK Ltd and Tickmill Europe Ltd respectively. You should consider whether you understand how CFDs work and whether you can afford to take the high risk of losing your money.
Futures and Options: Trading futures and options on margin carries a high degree of risk and may result in losses exceeding your initial investment. These products are not suitable for all investors. Ensure you fully understand the risks and take appropriate care to manage your risk.
Patrick has been involved in the financial markets for well over a decade as a self-educated professional trader and money manager. Flitting between the roles of market commentator, analyst and mentor, Patrick has improved the technical skills and psychological stance of literally hundreds of traders – coaching them to become savvy market operators!